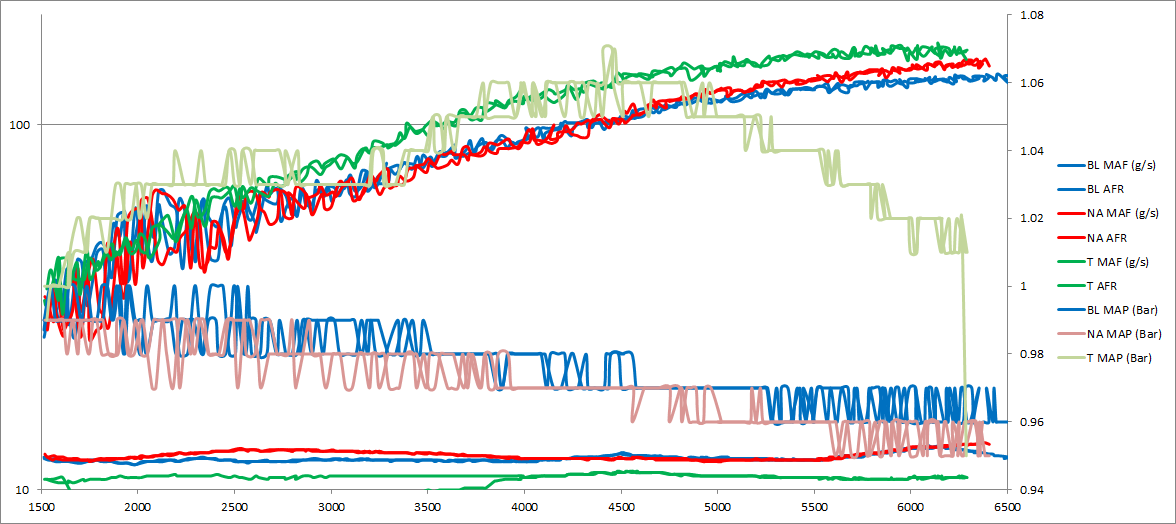
To reiterate, the red line *is* a tune (note stock is not shown), and both red and blue are 93octane tunes. The process required by DT requests two WOT pulls, so the two red lines are back to back and the two blue lines are back to back. But the red and blue are not back to back, they are from two different tunes about 3 weeks apart.
Like I said, this is a quick and dirty comparo, nothing else. They are on a time scale b/c it would take more effort to sync the two runs on an rpm scale, and the purpose of the graph is just to communicate that there is some noticeable difference, nothing more. Also, the calculations I used for hp are VERY simplified and do not account for many things, like variations in BSFC or ICE thermodynamic efficiency through the rev range for example.
Environmental conditions absolutely were different (though in the favor of the red line), but it was the same stretch of road. Definitely do not use this graph to compare to other engines, but I just posted it to show that (IMO) the gains I feel are real.
Last edited:
")