A Tune?

To reiterate, the red line *is* a tune (note stock is not shown), and both red and blue are 93octane tunes. The process required by DT requests two WOT pulls, so the two red lines are back to back and the two blue lines are back to back. But the red and blue are not back to back, they are from two different tunes about 3 weeks apart.

Like I said, this is a quick and dirty comparo, nothing else. They are on a time scale b/c it would take more effort to sync the two runs on an rpm scale, and the purpose of the graph is just to communicate that there is some noticeable difference, nothing more. Also, the calculations I used for hp are VERY simplified and do not account for many things, like variations in BSFC or ICE thermodynamic efficiency through the rev range for example.

Environmental conditions absolutely were different (though in the favor of the red line), but it was the same stretch of road. Definitely do not use this graph to compare to other engines, but I just posted it to show that (IMO) the gains I feel are real.
 
Last edited:
sac02, I was wondering what performance modifications you have made besides working on the ECU tune or what modifications you plan to make. I know a turbo is in the works, but I'm just interested to see if you've done any minor mods and what your impressions may have been.
 
No power mods other than the ECU tuning (and future turbo).

AST coilovers, lightweight 17x8 wheels w/ Michelin Pilot Super Sport tires, and ms3 RSB.
 
While quick & dirty, those graphs are really promising. I didn't expect such significant gains from an NA tune. Mazda's OEM tune must be waaaay conservative to allow for so much room for improvement. Exciting, to say the least!

Be sure to remind them that you basically ARE their marketing department! ;)
 
To reiterate, the red line *is* a tune (note stock is not shown), and both red and blue are 93octane tunes. The process required by DT requests two WOT pulls, so the two red lines are back to back and the two blue lines are back to back. But the red and blue are not back to back, they are from two different tunes about 3 weeks apart.

Like I said, this is a quick and dirty comparo, nothing else. They are on a time scale b/c it would take more effort to sync the two runs on an rpm scale, and the purpose of the graph is just to communicate that there is some noticeable difference, nothing more. Also, the calculations I used for hp are VERY simplified and do not account for many things, like variations in BSFC or ICE thermodynamic efficiency through the rev range for example.

Environmental conditions absolutely were different (though in the favor of the red line), but it was the same stretch of road. Definitely do not use this graph to compare to other engines, but I just posted it to show that (IMO) the gains I feel are real.
It would be great if you can plot a stock run. Even if the calculations are not 1000% accurate, it can still be a consistent for a comparison. The red is a tad misleading but understood you captured it in your tuning quest.

I don’t think this is your goal, but any chance you may be interested in pursuing a FE tune on regular gas :)? I’m more interested in FE gains, even if it means detuning output for a curve that suite my needs (obviously this depends on “how” much of a trade-off). Also, do you plan to have one optimized turn and run that year round or load different maps as seasons change and/or race events you partake? Just thinking out loud how this may/may not work for someone that goes through 4 seasons.


No power mods other than the ECU tuning (and future turbo).
AST coilovers, lightweight 17x8 wheels w/ Michelin Pilot Super Sport tires, and ms3 RSB.
These are indirect power mods. You’ve got an awesome setup there! You really are setup for autoX. Are you looking to go into road courses once the turbo is in? You, sir, need a blog (not just a thread).

Btw, might I ask what your alignment specs are? I’ve been poking around to see what works well and I think yours might be a good baseline to go off of.
 
Last edited:
It would be great if you can plot a stock run. Even if the calculations are not 1000% accurate, it can still be a consistent for a comparison. The red is a tad misleading but understood you captured it in your tuning quest.

I don’t think this is your goal, but any chance you may be interested in pursuing a FE tune on regular gas :)? I’m more interested in FE gains, even if it means detuning output for a curve that suite my needs (obviously this depends on “how” much of a trade-off). Also, do you plan to have one optimized turn and run that year round or load different maps as seasons change and/or race events you partake? Just thinking out loud how this may/may not work for someone that goes through 4 seasons.


These are indirect power mods. You’ve got an awesome setup there! You really are setup for autoX. Are you looking to go into road courses once the turbo is in? You, sir, need a blog (not just a thread).

Btw, might I ask what your alignment specs are? I’ve been poking around to see what works well and I think yours might be a good baseline to go off of.

Yes, I will definitely do a comparison with the stock tune, but later. I took some logs of stock before starting the tuning process with DT, but wasn't logging the right things. So I don't have that data to compare right now. When the DT tuning is done and I've got a copy of the stock tune, I'll reload it and take logs to get meaningful comparison data.

I have no plans for a FE tune. I'm sure you could call Joe at DT and ask about it, he's always friendly and willing to talk when I get him on the phone (phone is better than email IME). If the ONLY reason you were getting tuned was for better MPG, idk if it would be worth it (or it would at least take several years to pay off) based on my calculations. At this point I don't plan to have different tunes for road/track/drag/whatever. I just want one reliable (even conservative) tune to DD. I'm not trying to make massive power or build a racecar to challenge for SCCA championships.

The wheels and tires are kind of indirect power mods (less static and rotational inertia = faster acceleration), but this is not reflected in the graphs I posted. the graphs are basically just a quick and dirty scalar of MAF (and hence fuel) flow. It's BHP, all before F=MA comes into play. If I was judging HP at the wheels based on accelerometer values, weight, and gearing, then the new wheels/tires would definitely matter (or at least need to be accounted for). Also, the wheels/tires were the first thing I did, so they have been a constant through all testing.

I'll have to get back to you on the alignment, I can't remember exactly the numbers I settled at off the top of my head. It's a bit aggressive, but not outrageous. Something in the range of 2.0mm toe out in the Front, and 0.5mm toe out in the rear? I've been keeping a close eye on tire wear, and nothing noticeable after about 3k miles.
 
Last edited:
Still tuning, but here's a teaser.
BHP calculation/estimation
First tune file (red) vs fourth tune file (blue).
X-axis is time, not RPM (it's a quick and dirty graph)
I don't have stock data, as I wasn't logging the right things previously using the Torque app (these data are logged using mazdaEdit). I will go back and get data for stock at some point in the future.
But the stock power is certainly below the red line, I could feel a distinct difference in the first tune file. As a reference, Mazda-published BHP is 157 for the 2.5L

Those are pretty impressive gains!

As for a baseline though, I'm pretty sure you've seen my dyno post. I think Mazda rated these engines conservatively- maybe to make up for the greater loss through the manual transmission- but my engine showed a good bit healthier than factory spec. The 2.3L is only rated at 153hp/148lbft at the crank, and I put down 143/141 to the wheels with only a K&N drop in plus wheels/tires that are 4 pounds lighter per corner. Scaling up through a standard assumed 15% loss through a good FWD manual transmission, that puts me at 168hp/166lbft at the crank, 15hp and almost 20lbft more than spec. Lighter wheels won't account for all that. Your 2.5L may be a bit healthier than spec from the factory too. Maybe all of ours are- one can hope, right?

mz5_baseline.jpg
 
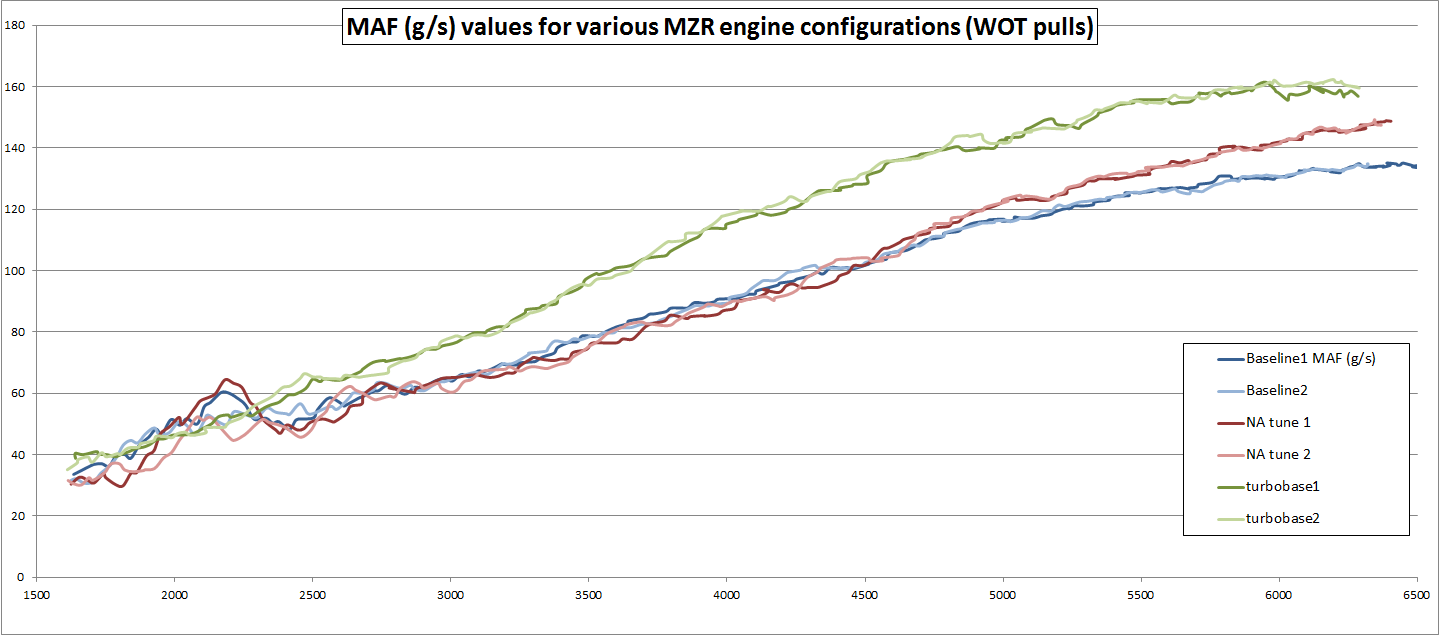
Maximum MAF (g/s) values that I saw:
Stock: 138g/s
NA tuned: 153g/s
turbo, "as close to 0 boost as possible": 167g/s

(Turbo tune) AFR hovering around 10 during WOT

More random data points please! 
Be great if you can post more on the stock tune vs. NA tune.


Your data points show the engine was optimized to take in about ~11% (10.8) more air with the NA tune over stock tune. Was this on regular gas or premium?
 
Last edited:
To answer the above question: The baseline and NA tune datalogs were both done on 93 octane fuel. I normally ran regular 87 octane when the car was stock because there is no advantage to running premium gas when the car is designed and tuned for regular. But I had filled up with 93 in preparation for the tuning to begin (tuned requires 93 octane), and took the baseline datalog with the 93 octane.

The process for taking datalogs after loading a new file consists of first driving for 20+ minutes to learn values and settle the fuel trims, then a 20 minute drive with 2 WOT pulls near the end. My normal routine is to use my drive to work to take datalogs, because it is a good mix of low-speed neighborhood, congested highway, open highway, and moderate-speed country roads, with a good secluded road to do the WOT pulls on the same stretch of road each time with no other cars around every time.

Below is a graph of the MAF values for the various configurations. (some smoothing applied)

t7GTnMt.png


There are two pulls for each configuration. I’m intrigued by the “hump” in MAF values at 2200rpm. It appears similarly in the FIRST pull of both the Baseline and NA Tune, but not the second pulls. (I double checked to make sure I didn’t mix up numbers somewhere). I wonder what is going on there.

Another thing that I thought was noteworthy: The graph doesn't display the increase in mid-range power that I felt from the tuning process. IMO the most significant gains were felt in the middle-low rpm range from 2000-3000 rpm. Before tuning, the engine was dead until almost 3500rpm. Tuning unlocked significant power in this portion of the rpm band.

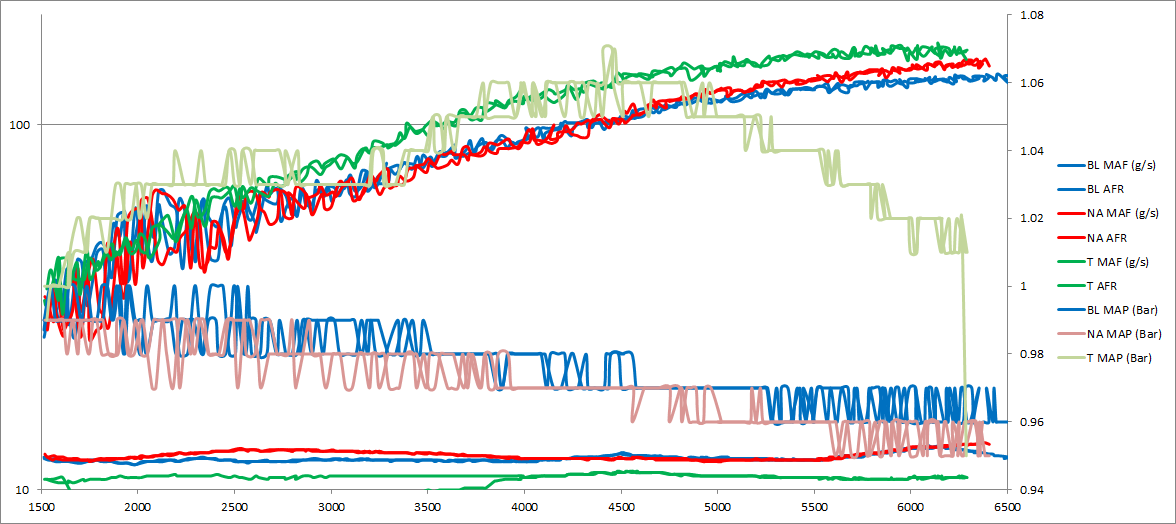
Below is the current AFR situation. This data is from the same WOT pulls as above, I forgot the graph title, sorry. It would be premature to read too much into the TurboBase AFR at this point, considering that it is still so early in the tuning process (I'm not making boost, or even using final injector sizes). But it at least indicates that the AFR will be richer for the turbo application, as expected.

1Pa0xDE.png


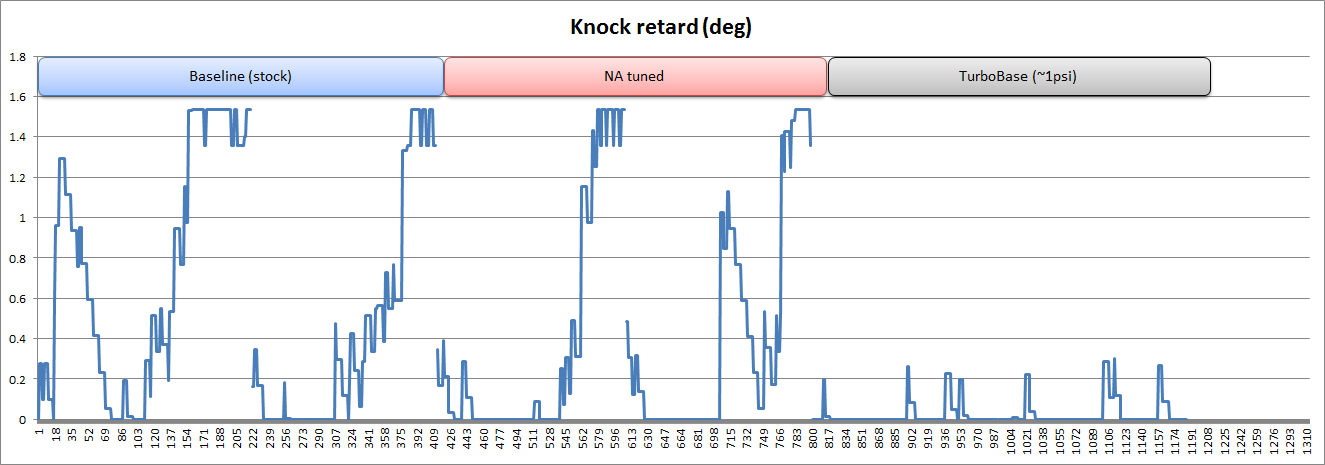
Another difference I see in the data (no graph for this one) is that with both the baseline and tuned NA variations, I would see KR up to 1.5 With the current TurboBase tune, the most KR I see is 0.3 - this could be considered evidence that the tune is richer or more conservative timing than it "needs" to be at the moment, though it's worth stating again that this is not the final configuration that I'm tuning for, so it's just meaningless numbers at the moment.

edit:
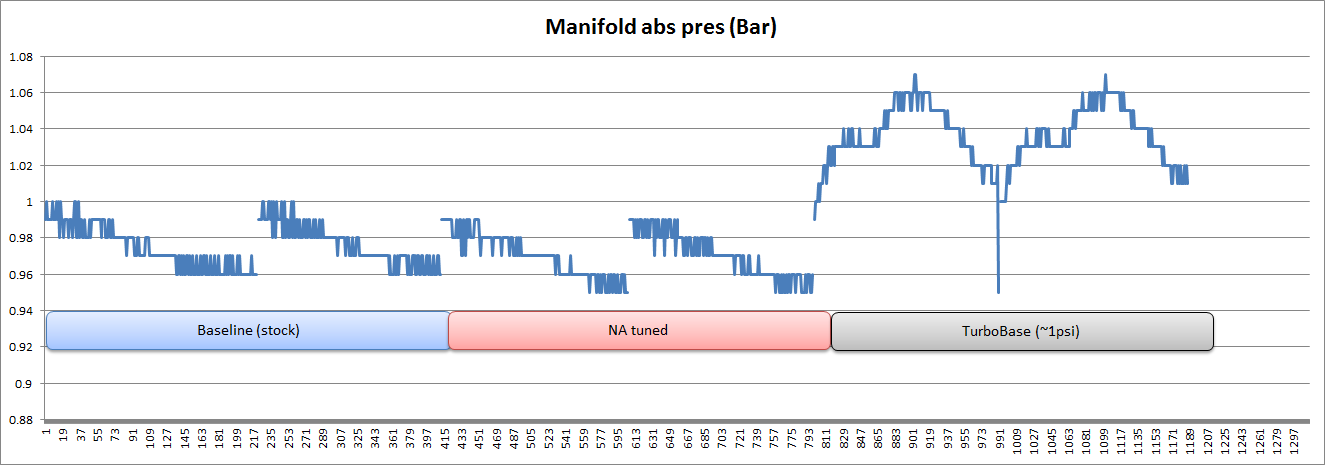
OK, I lied - here are graphs of KR and MAP:

Oj7jABG.png


dIoPD8H.png
 
Last edited:
Thanks! I’m looking more intently at the Base and NA tune. Very glad you used 93 for a consistent basis!  I’m not a tuner and just learning as we go but some observations and questions and correct me if I’m wrong.

-On the AFR graph, it looks like the NA Tune runs a little leaner between 2K – 3.75k RPM than stock; near stoich with a little head room. This is probably 90% of everyday usage. Looks good! But why does it get leaner in the higher RPMs? I was under the impression that engines run really rich in the high RPMS to prevent denotation (KS kick in).

Looks like the X axis on the KR and MAP graphs is one continuous time scale. Were the runs measured precisely in the same intervals? Could you align it with the RPM scale? Could you overlay the stock and NA tune or match them to the other charts?

Can you put more granularity on the MAP chart and/or possibly align them to the AFR runs individually? I like that the NA tune MAP is lower than the stock. I understand MAP correlates to engine load so it is working more efficiently (less fuel while doing more work).

What is your MPG like in your everyday driving with the zero boost turbo tune?


Googled Dynotronics’s Facebook and found this! If I can see one for a 2.3 and confirm, I’m all in. If I’m on the 2.5, I’d be in too. Just not sure if the 2.3 will return much…
https://www.facebook.com/pages/Dynotronics-Inc/116801398378172?ref=stream
We just finished dialing in a customers 2010 Mazda 2.5.

Car is completely stock except for a SRI.

Check out the gains! Car is now a riot to drive!
575788_634394343285539_1059715335_n.png
 
Last edited:
On the AFR graph, it looks like the NA Tune runs a little leaner between 2K 3.75k RPM than stock; near stoich with a little head room. This is probably 90% of everyday usage. Looks good! But why does it get leaner in the higher RPMs? I was under the impression that engines run really rich in the high RPMS to prevent denotation (KS kick in).

Regarding your 90% comment, remember this is a WOT pull. 2k-3.5k might be 90% of driving at normal throttle angles, I doubt you're WOT 90% of the time... Or maybe you are? :)

I can't answer that Q about the high-RPM AFRs - I'm just taking the data, not making the tuning decisions, in this case.

Looks like the X axis on the KR and MAP graphs is one continuous time scale. Were the runs measured precisely in the same intervals? Could you align it with the RPM scale? Could you overlay the stock and NA tune or match them to the other charts?
Yeah, I thought that might be confusing, but I didn't want to put in time to make "proper" graphs. I just put all the WOT data in one column and plotted a line graph. Plotting a scatter graph with rpm as the X-axis and separate series for each would take 10 minutes I didn't want to spend on this level of "rough overview". I think this gets the point across, of how the parameters compare in different tunes. The time scale is the same between them all, 10Hz I think is what the datalogger is set at.

Can you put more granularity on the MAP chart and/or possibly align them to the AFR runs individually? I like that the NA tune MAP is lower than the stock. I understand MAP correlates to engine load so it is working more efficiently (less fuel while doing more work).

What is your MPG like in your everyday driving with the zero boost turbo tune?

More resolution in the MAP data? No, that's the values that the ECU provides.

I'm not sure I would read that into the MAP difference b/t the baseline and NA tune. I think that 0.01bar variation you're seeing is just as easily (or more likely) explained with variation in atmospheric pressure.

My MPG since the turbo install (still with no boost) has been 21.4, 23.6, and 22.5mpg, and I think this next tank I am going to get tonight will be ~21 based on my miles on this tank. Below the current lifetime average of 23.6mpg, but as mentioned, AFRs are pretty rich.
 
hAye3zf.png


Also worth noting: the baseline pull had better conditions than the other two runs, so it is probably "overacheiving" (very) slightly. Ambient temps and IAT were lower (by about 20deg), and the ambient pressure was higher (though 0.01 is probably well within the error range of the sensor).
 
Last edited:
I read through this thread, is there a tune for a N/A 2.3 5? I am down for one if there is. Keeping the car so might as well wring the crap out of it! ha ha.
 
I read through this thread, is there a tune for a N/A 2.3 5? I am down for one if there is. Keeping the car so might as well wring the crap out of it! ha ha.
I contacted Dynotronics about that and they said they had a tune package ready to go. I'm a bit concerned about how long sac02 and rodslinger have been dealing with them, but an NA tune might go much smoother and quicker.
 
Zen-like levels of patience is key. If you want to have your tune done in a week (lol...), or even a month, don't do this (Dynotronics tune). If you go into it with the expectation that it will take several months, maybe longer, then IMO tuning is worth it. The difference in the NA engine was significant.
 
Last edited:
Back